Australia has good health care as well as campaigns to improve awareness of health issues; Australians enjoy, for the most part, access to a wide variety of fresh foods, however, our rates of chronic disease, specifically obesity, are on the rise. In fact, obesity rates are a global concern with approximately 70% of those affected by obesity living in developing nations (Ahmed & Mohammed, 2025). Further to this, our diets are seeing an emergence of malnutrition in those with obesity due to the lack of nutrients in the foods being consumed (Kobylińska, 2024).
Let’s compare the Australian diet with other countries to see what they are doing right, what we can learn from and possibly implement to improve our diets.
The Food and Agriculture Organisation of the United Nations (FAOSTAT) is a comprehensive database on food and agriculture. The Australian Bureau of Statistics is the national statistical agency which collects data on a number economic, social and environmental indicators. This research uses the data on dietary intakes which FAOSTAT has available for Brazil (2017-2018), Mexico (2016) and Saint Kitts and Nevis (2020), against the Australian Bureau of Statistics (ABS) National Nutrition and Physical Survey, 2023 to analyse the health and trends of our diet.
Odd combination of countries right?
Collecting data on a population’s intake of food takes time and money; as a result surveys are not done very often. FAOSTAT currently only has intake data on Brazil, Mexico and Saint Kitts and Nevis. Since WHO recommendations are specifically developed to provide dietary goals that can be reached worldwide, and, given that trends in consumption of fruit and vegetables are slow to change, a comparison of daily intake from these countries from different years will offer valuable insight into the factors affecting diets worldwide, regardless of income.
Brazil, South America: 4th largest producer of food
In 2014, Brazil implemented revolutionary dietary guidelines which focused on behaviours, such as opting to eat with company and refraining from doing other activities while mindfully eating. The message was to enjoy the whole process involved with eating, from the planning, cooking and eating to make it an important part of daily life, not to be rushed. When choosing food the Brazilian guidelines encourage the use of whole foods while being conscious of where the food comes from and it’s sustainability. The guidelines also ask Brazilians to be wary of the way certain foods are advertised and marketed (FAO, 2014 & Gabe, 2021).
Mexico, North America: 7th largest food exporter
The Mexican government, in 2014, implemented a 12% tax on sugary drinks and an 8% tax on foods with a calorie value greater than 275 per 100 grams (with the exception of food staples such as beans, oils, sugar and flour). Even though there has been a decrease in the sale of these items, the taxes did not cause a decrease in the calorie intake of the population (Aguilar, 2021). Further to this, they have implemented bans on the sale of junk food around the vicinity of schools as well as limitations as to their marketing and advertising with the use of warning labels. The dietary recommendation, like Brazil’s, also focus on taking time to eat food with company, to avoid overeating and aim to include fruit and vegetables, cereals or legumes and animal protein at every meal (FAO, 2015).
Saint Kitts and Nevis, Carribean: heavily reliant on food imports
Due to it’s vulnerability to climate events and small land mass, approximately 60 – 80% of the island’s food is imported and is responsible for providing the people with cheap, highly processed foods. Their food guidelines warn against the high salt content of some cultural foods and prohibits items such as pork and mayonnaise from being served at schools. Further to this, there is an emphasis on how food choices effect mental health (Carribean nutrition awareness month, 2023). To combat the cost of importing foods, both on an economic and health front, the country is looking at reducing it’s dependence of imports by 25% by 2030 and focusing on producing their own foods and introducing a tax on sugary drinks.
Australia:
Australia’s food labelling standards require all packaged foods to display the ingredients, origin and nutritional breakdown of foods. It ensures nutritional claims made on packaging meet a certain threshold. Australia also has a voluntary 5 star health rating system , that at a glance rates how healthy a food item is based on the amount of energy in kilojoules, nutritional benefits and the addition of unhealthy ingredients (Department of Health, Disability and Aging, 2025). As other countries around the world turn to initiative policies to reduce the lure and hold that highly processed foods have on us, Australia has remained stagnant in it’s policies to address our poor diet and the factors contributing to our poor food choices.
What are we eating:
We all know that we should be consuming a variety of types and colours of fruit and vegetables in our diet. This provides enormous health benefits and is an essential part of a healthy diet, providing the vitamins, minerals, fibre, antioxidants as well as other essential nutrients needed by our bodies. This also reduces the risk of chronic diseases (WHO, 2023). So how much fruit and vegetables do we consume?
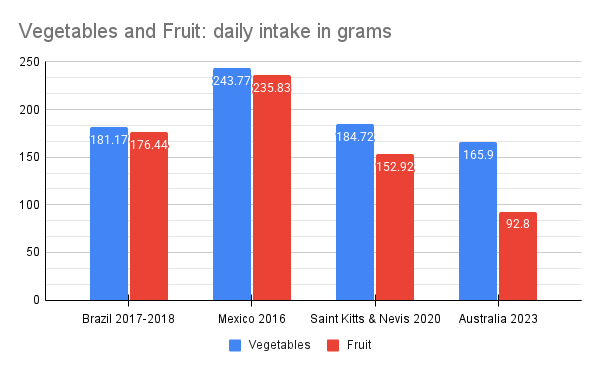
Figure 2
Source: FAOSTAT and ABS National Nutrition and Physical Activity Survey, 2023
While most of us strive to increase our fruit and vegetable intake for health reasons, Mexico is already exceeding the recommendations. This raises the question, can we improve our diets by simply increasing our fruit and vegetable intake?
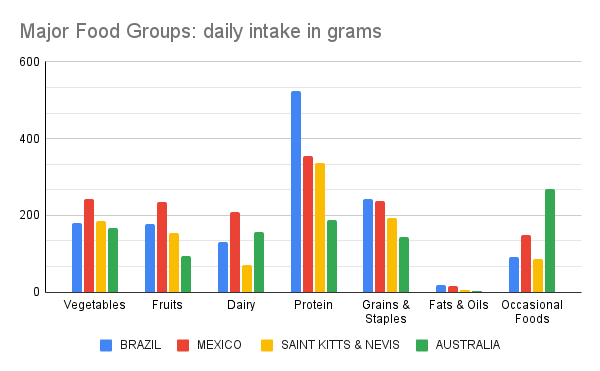
Figure 3
Source: FAOSTAT and ABS National Nutrition and Physical Activity Survey, 2023.
In Australia, the most consumed food group, alarmingly, is occasional foods. This category contains foods such as confectionary, sugar based products (honey, jams, spread and sauces), snack foods and baked and mixed goods (biscuits, cakes, pastries, pasta and pizza). These occasional foods are intended to be consumed in small portions and sporadically but Australians are doing the opposite, with approximately 24% of our daily intake belonging to food items in this category.
In contrast, Brazil, Mexico and Saint Kitts & Nevis show different dietary priorities. Brazil has the highest levels of protein intake which makes up approximately 38.5% of the Brazilian diet and is their most consumed food group.
While the data from Saint Kitts & Nevis shows the lowest intake of occasional food, approximately 68% less than Australia, it also shows that their obesity rates are the highest of the four researched countries; Figure 4 below, proves to highlight the challenges in collecting accurate data as well as the complex factors involved in health and diet.
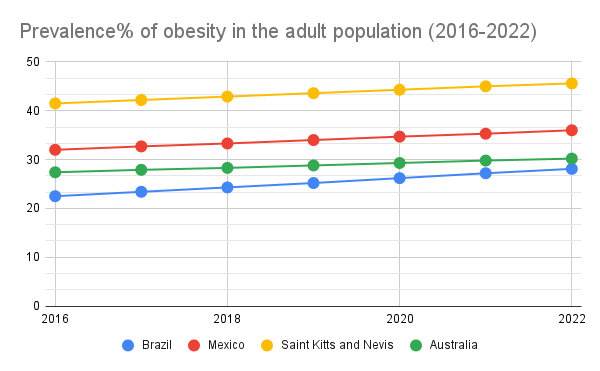
Figure 4.
Source: FAOSTAT suite of food security indicators (obesity)